¶ Switching between space and time: Spatio-temporal analysis with
cubble 
ECSS Miniconference 2022
2022 Nov 17
Hi!
A third year PhD student at Monash University, Melbourne, Australia
My research centers on exploring multivariate spatio-temporal data with data wrangling and visualisation tool.
Find me on
- Twitter:
huizezhangsh, - GitHub:
huizezhang-sherry, and https://huizezhangsh.netlify.app/
- Twitter:

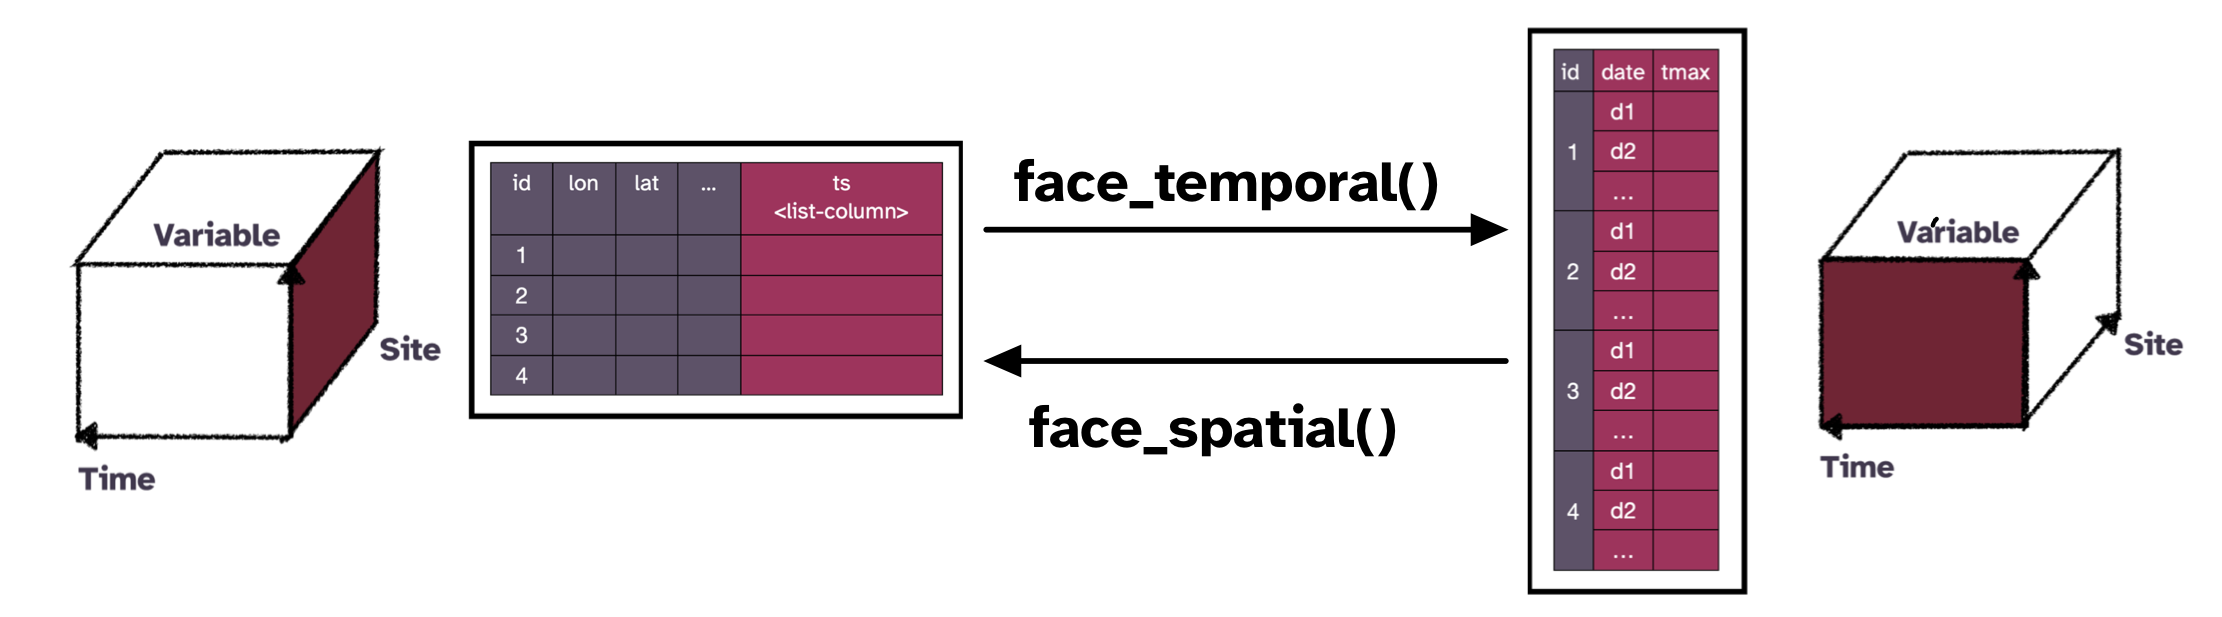
Cubble: a spatio-temporal vector data structure

Cubble: a spatio-temporal vector data structure
Cubble is a nested object built on tibble that allow easy pivoting between spatial and temporal form.
Australian weather station data:
# A tibble: 30 × 6
  id            lat  long  elev name                       wmo_id
  <chr>       <dbl> <dbl> <dbl> <chr>                       <dbl>
1 ASN00060139 -31.4  153.   4.2 port macquarie airport aws  94786
2 ASN00068228 -34.4  151.  10   bellambi aws                94749
3 ASN00017123 -28.1  140.  37.8 moomba airport              95481
4 ASN00081049 -36.4  145. 114   tatura inst sustainable ag  95836
5 ASN00018201 -32.5  138.  14   port augusta aero           95666
# … with 25 more rows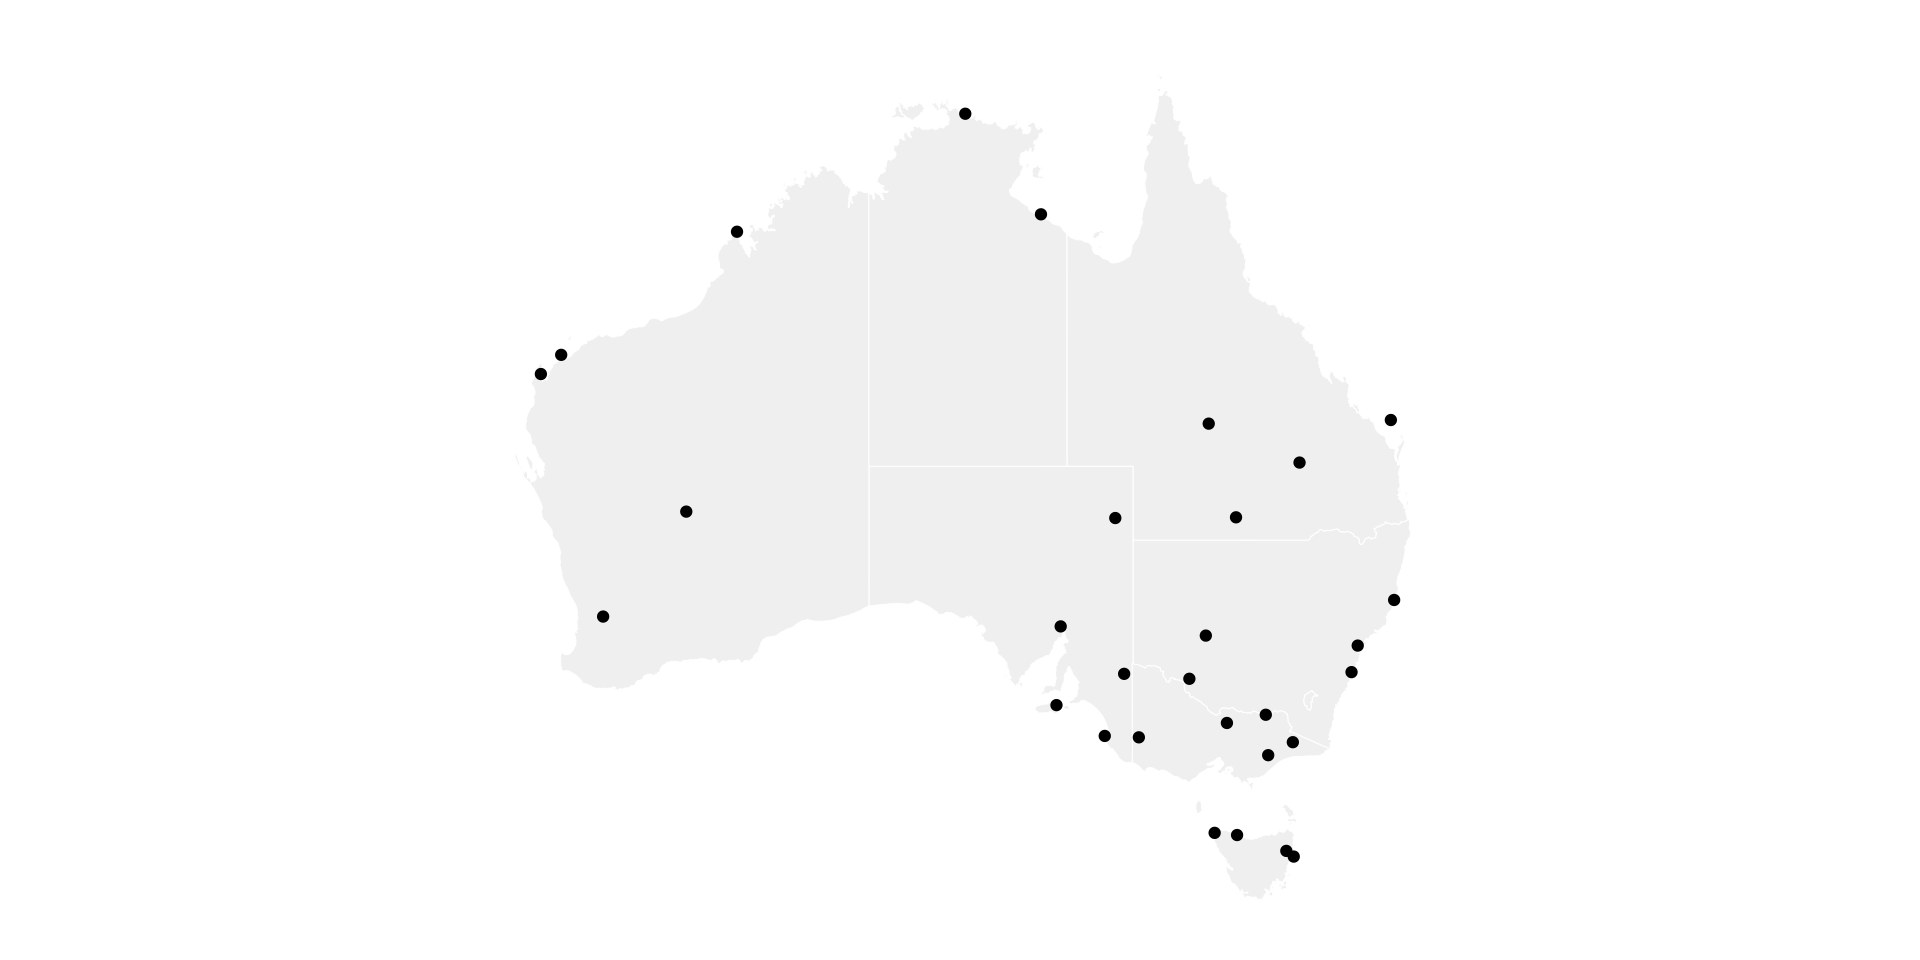
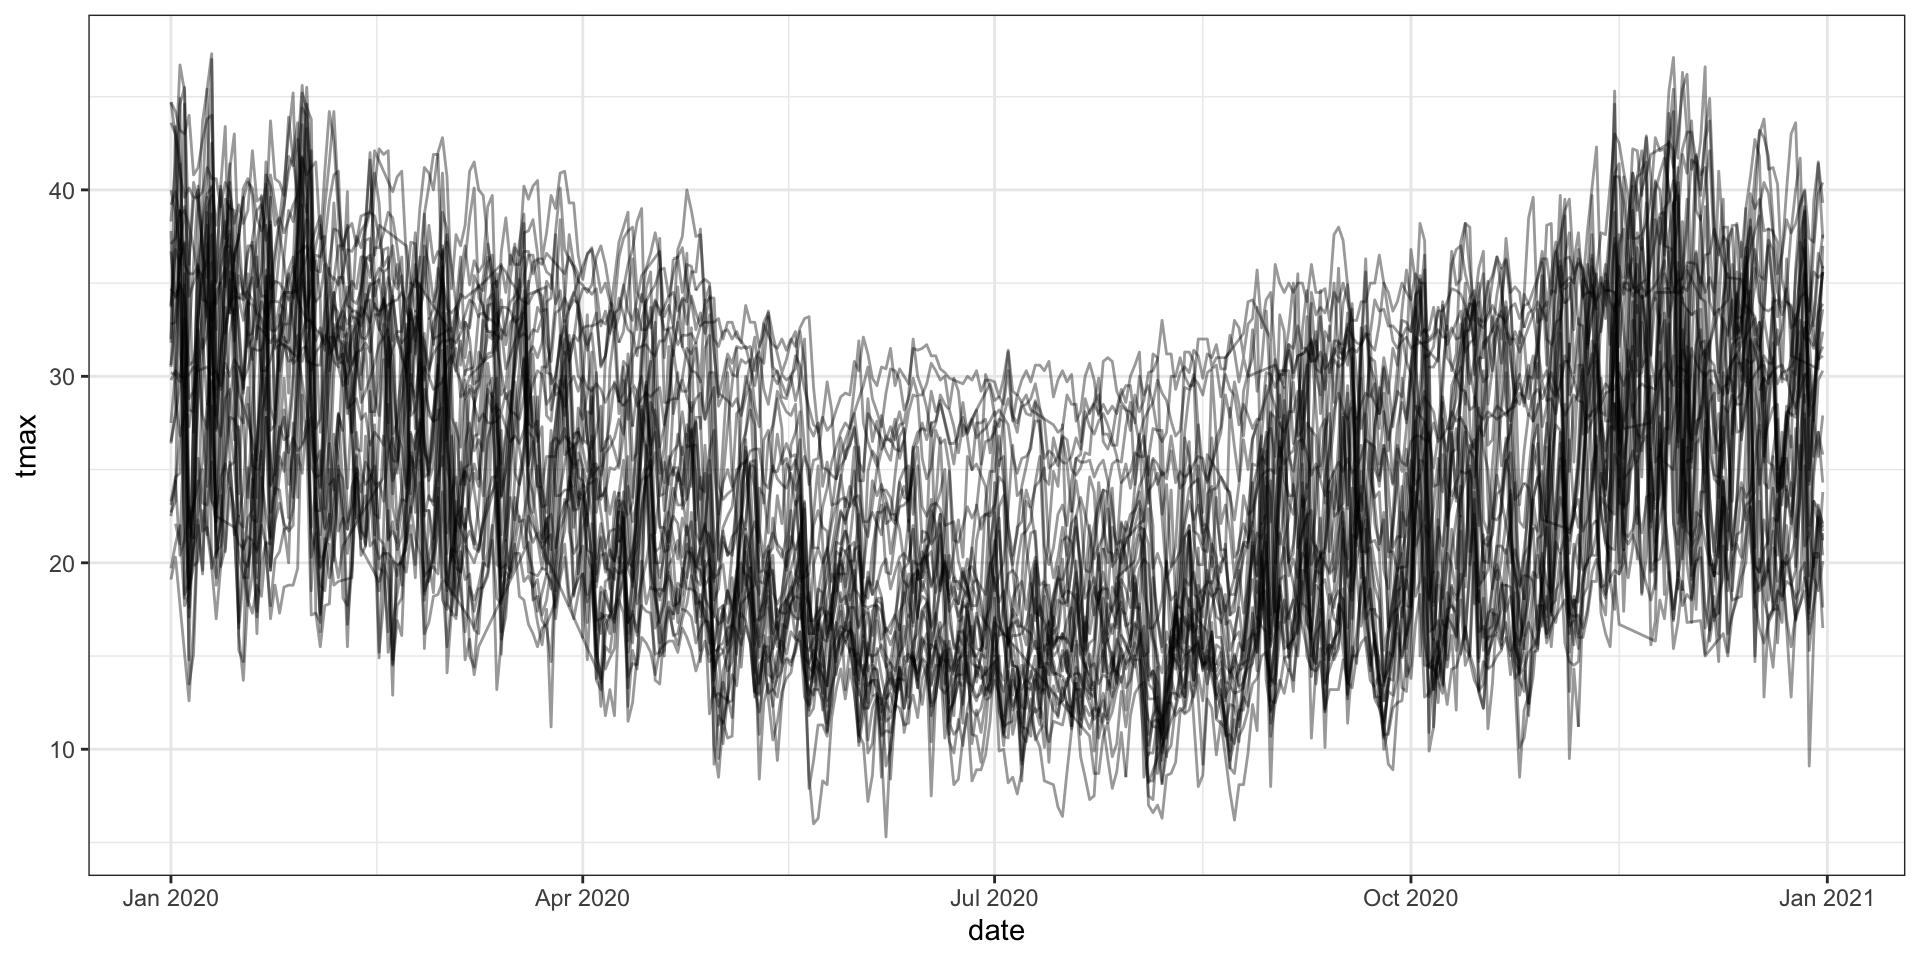
Glyph map transformation
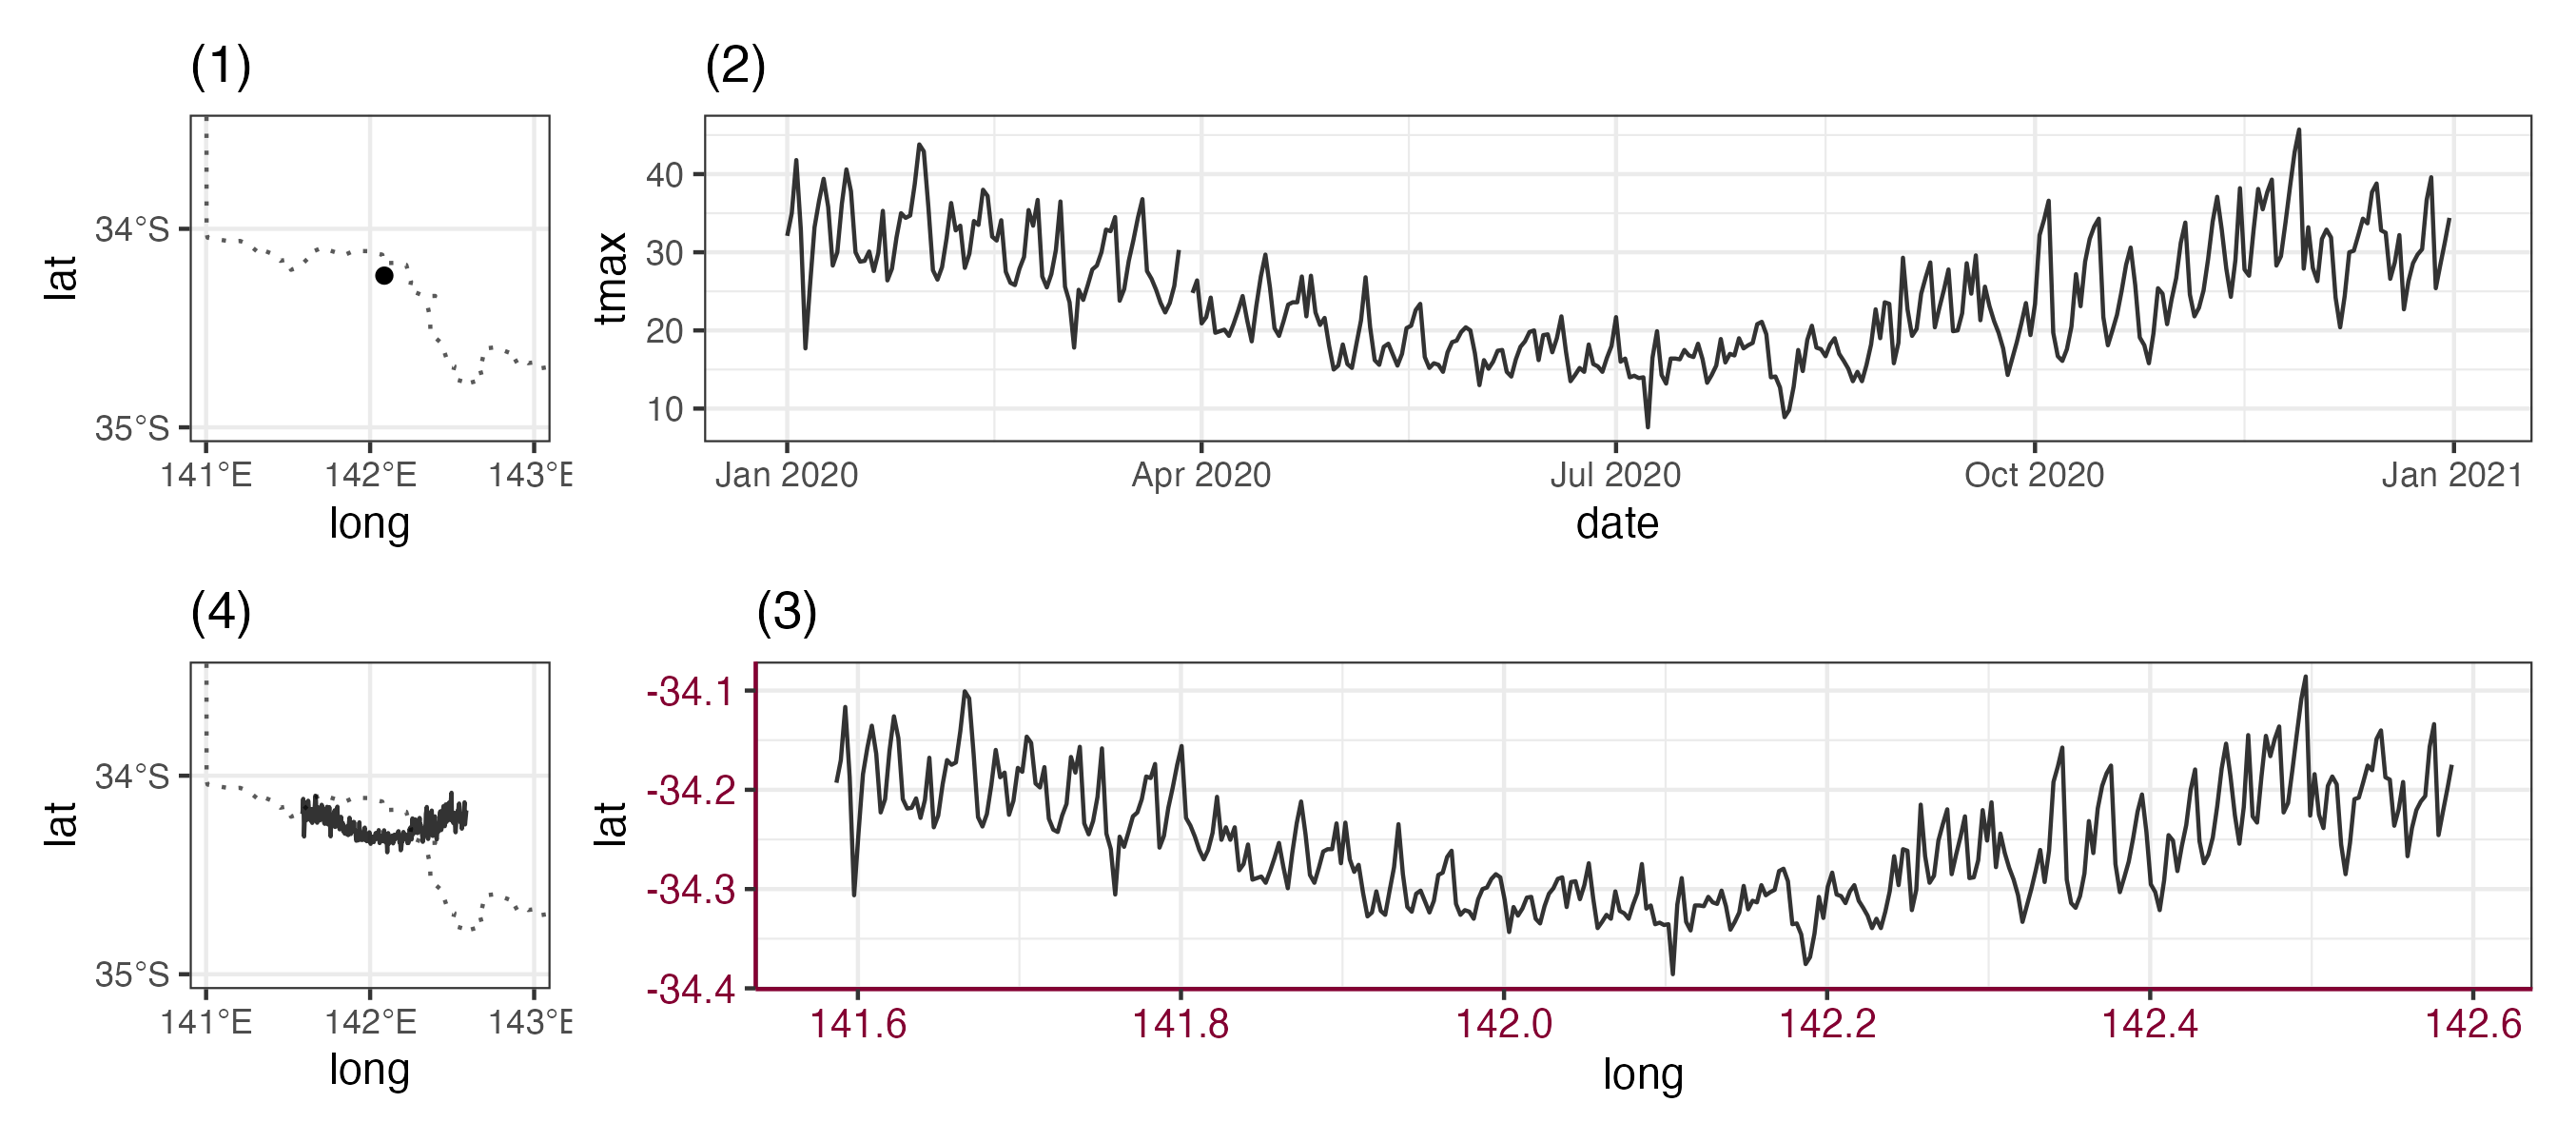
Avg. max. temperature on the map
cb <- as_cubble(
  list(spatial = stations, temporal = ts),
  key = id, index = date, coords = c(long, lat)
)

set.seed(0927)
cb_glyph <- cb %>%
  slice_sample(n = 20) %>%
  face_temporal() %>%
  mutate(month = lubridate::month(date)) %>%
  group_by(month) %>%
  summarise(tmax = mean(tmax, na.rm = TRUE)) %>%
  unfold(long, lat)

ggplot() +
  geom_sf(data = oz_simp,
          fill = "grey95",
          color = "white") +
  geom_glyph(
    data = cb_glyph,
    aes(x_major = long, x_minor = month,
        y_major = lat, y_minor = tmax),
    width = 2, height = 0.7) +
  ggthemes::theme_map()